Exposure Metrics, Part 2
Part 2: Dose-Exposure-Response Analysis
Introduction
In our previous post, we described how to summarize concentration-time profiles as a single numeric measure of exposure. Models that relate exposure to response serve a valuable purpose in model-informed drug development. Generating a model that can predict response across a range of exposures allows for dose selection to be refined to keep exposure within the window of optimized safety and efficacy outcomes in alignment with FDA guidelines, including Project Optimus.
Modeling with Exposure Metrics
In exposure-response analysis, models are developed to relate exposure metrics to efficacy and safety outcomes. These models can take different forms depending on the type of data available and the focus of the analysis. Some of the most common forms are linear regression, logistic regression, and time-to-event modeling.
Linear regression models are used to estimate exposure effects on continuous response variables. In oncology, tumor reduction at a landmark time point is commonly modeled using linear regression.
Logistic regression is used to estimate exposure effects on the probability of an event of interest occurring. For example, to determine the exposure-efficacy relationship of an oncology drug, logistic regression could estimate the relationship between average concentration at steady state and whether or not a patient achieves objective response. In the context of safety, logistic regression is used to predict whether or not patients will experience an adverse event.
Time to event models relate exposure to the risk of a given outcome over the time-course of treatment. Progression-free survival (PFS) is an endpoint that describes the time until an oncology patient has cancer progression or dies by any cause. A time-to-event model can be developed to relate drug exposure over time to PFS.
The outputs of these model simulations under different dosing scenarios and study designs are informative for selecting or justifying doses and dosing regimens.
Using Exposures to Inform Dose Recommendations
A key utility of exposure-response modeling is the ability to predict responses across the entire range of relevant exposure values. A well-characterized pharmacokinetic (PK) model can predict exposure across a range of dosing regimens, including those that have not yet been administered in a real study, and a well-characterized ER relationship can predict efficacy and safety outcomes on those regimens. The results of this analysis may inform dose selection for subsequent studies.
Suppose a recent clinical trial has collected data from patients receiving two doses of a study drug: 20 mg/kg QD or 40 mg/kg QD. But results indicate that neither dose achieves the desired results. On the lower dose, too few patients respond to treatment; on the higher dose, too many patients experience adverse events. Could a dose-exposure-response simulation help investigate an intermediary dose?
Interpolating Exposure Predictions
Average concentration at steady state (Cavg) is a common driver of efficacy and safety outcomes. An example PK model is used to predict the steady state concentration-time profiles of many randomly simulated patients receiving 30 mg/kg QD of this study drug. The simulated average concentrations at 30 mg/kg QD fall between the observed concentrations at the lower and higher doses.
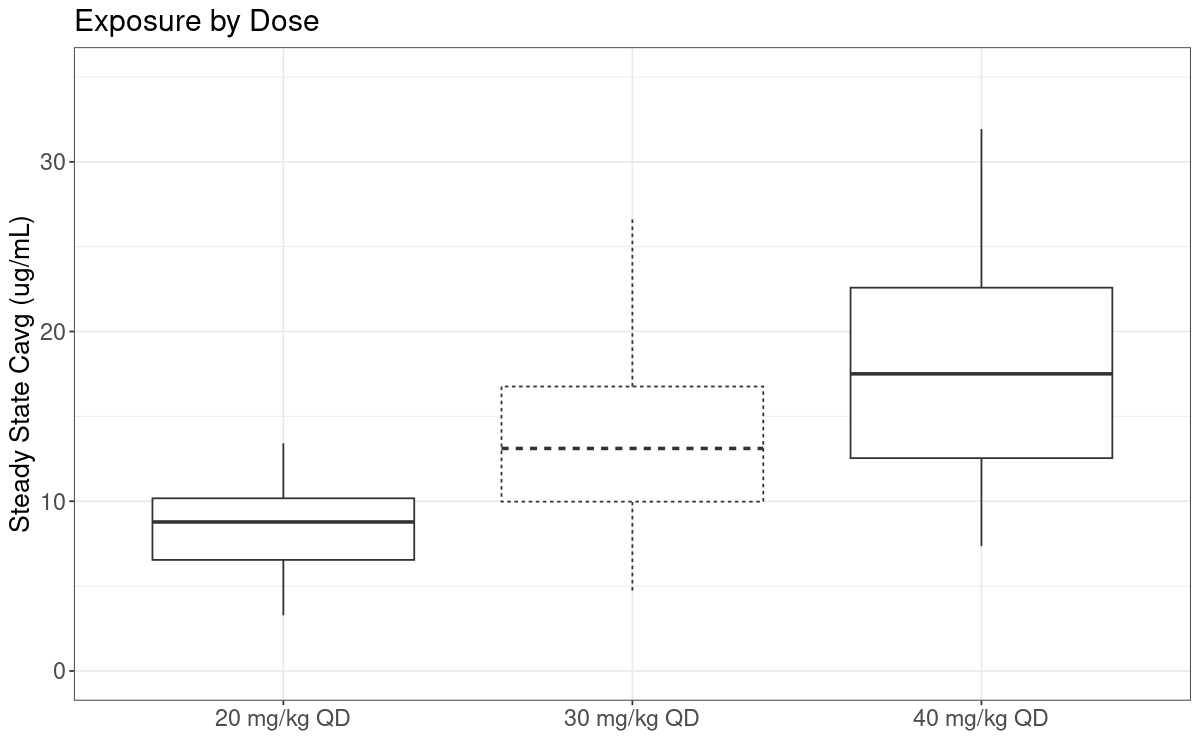
Exposure-Response Across the Interpolated Exposure Predictions
The exposure-efficacy relationship has been estimated using the clinical trial data, relating Cavg to the efficacious response. From this logistic regression ER model, we can predict the likelihood of the simulated patients achieving a response given their dose assignment of 30 mg/kg QD. If needed, a random outcome can be simulated for those patients, using that likelihood of response.
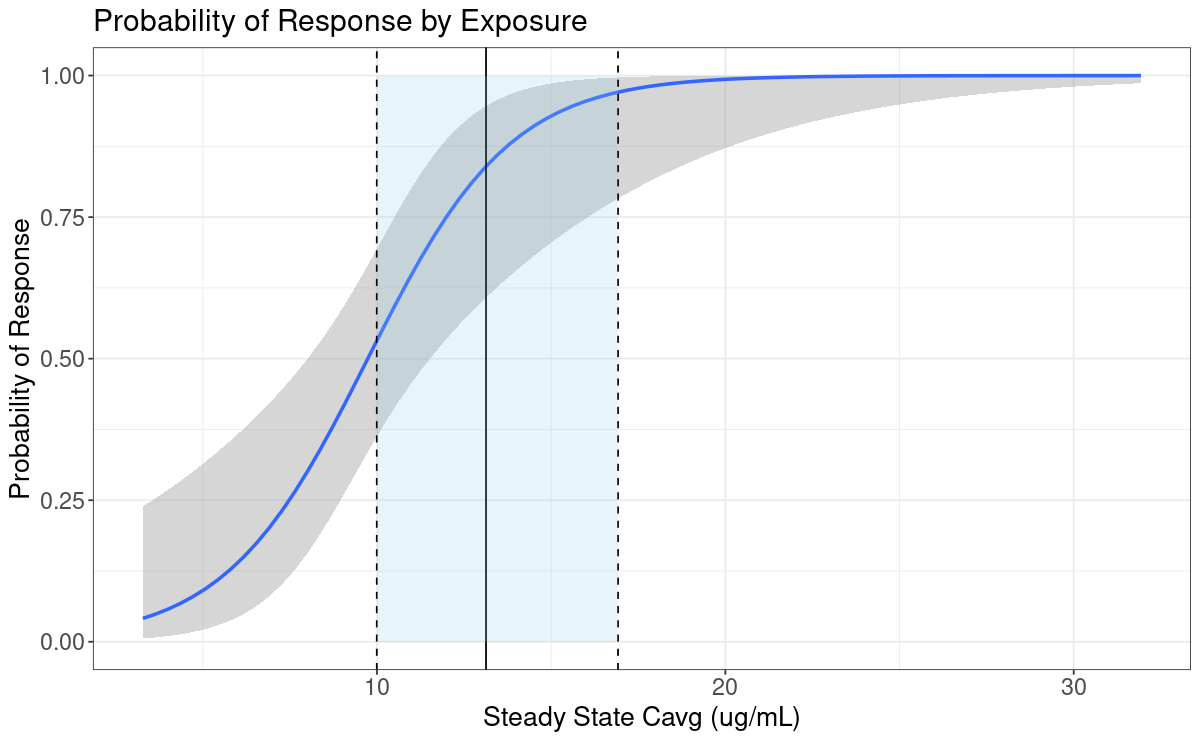
Estimating Dose-Response in the Population
This chain of simulations relating dose to exposure to response can be used to estimate dose-response relationships in the population. A large number of simulated patients were generated, and replicates of that simulated group were assigned to each of the three doses of interest. In each replicate, each patient’s average concentration at steady state was predicted; that exposure metric was used to predict their likelihood of response; and a response outcome was randomly generated using that likelihood. The sample proportion (95% CI) of responders was calculated within each dose assignment. Thus we achieve an estimate of the dose-response relationship that incorporates variability in PK and ER outcomes.
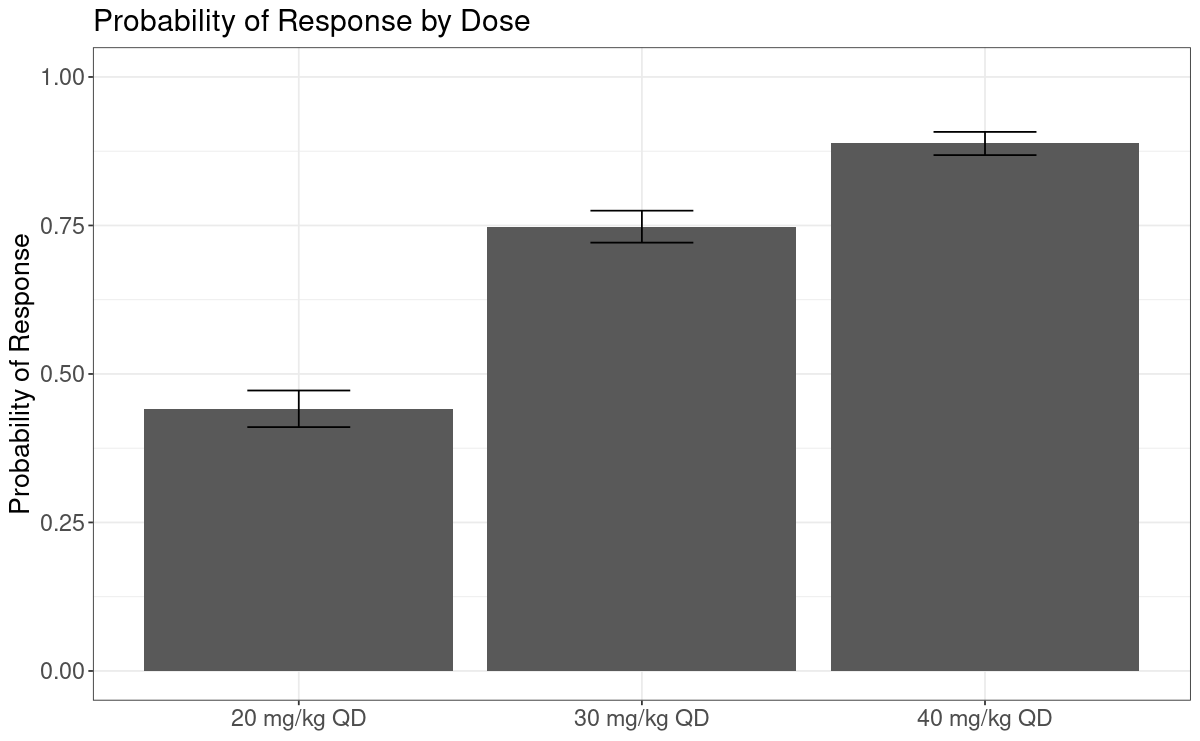
Efficacy outcomes improve as the dose increases, and each of the confidence intervals of estimated outcomes are non-overlapping. However, the increase from 20 mg/kg QD to 30 mg/kg QD is clinically significant (~30% increase in response) while the increase from 30 mg/kg QD to 40 mg/kg QD is more modest (~13% increase in response).
This exercise would be conducted in parallel using the exposure-safety model in order to derive the predicted probability of an adverse event at each dosing regimen. Investigators may determine that a dose of 20 mg/kg is not acceptable on the basis of efficacy, then use results of the safety simulation comparing 30 mg/kg and 40 mg/kg to make an informed selection of the final dose.
Conclusions
Accurate predictions of response to a drug at different dosing regimens can help to optimize clinical study design, or remove the need for a study altogether, and directly improve patient outcomes. While there is not always a direct relationship between dose and response, exposure bridges the gap and allows for models to be developed that can be used to predict outcomes across dosing regimens and make important program decisions.